Investing regularly in the stock market can help generate additional income also described as passive income.
Over the last 50 years the stock market has on average generated an average yearly return of around 7%, or 10% if reinvesting dividends. This has been calculated by looking back how the market has generated return during the period of 1970 and 2022.
Generating a sizeable additional income like the 20,000 in this example can be achieved by investing a steady amount each month.
Using the insight from the article about Compound Interest we have learned how long it takes for money invested to double. This helps us understand the timeframe that we must position ourselves with as it will take time to build the desired passive income.
The assumption of a yearly return of 7% means we need to build a portfolio of 286,000. This is calculated by dividing 20,000 with 7%. The big question here is how long does it take to get to this amount?
The table below illustrates how long (in years) it would take when contributing a certain amount each month.
| Initial Amount | Monthly Contribution | Years to Target |
|---|---|---|
| 250 | 250 | 30 |
| 500 | 500 | 21 ½ |
| 750 | 750 | 17 ¼ |
Illustration of 250 Contribution
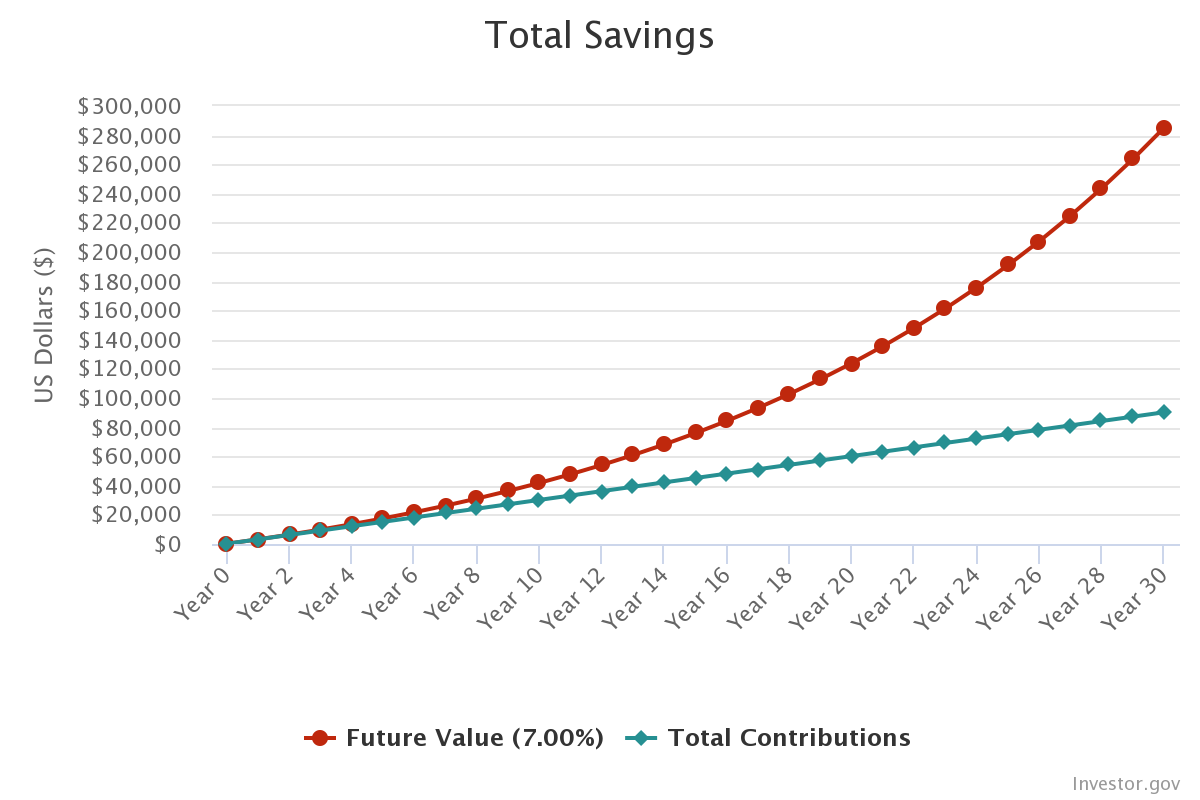
In the period of 30 years your monthly contribution of 250 will become 286.000. The vast majority will be derived from accumulation of the stock holdings as you will contributed just 90.250. The effects of compound interest will be the largest contributor to the wealth especially because you are letting the money vest over 30 years.
Illustration of 500 Contribution
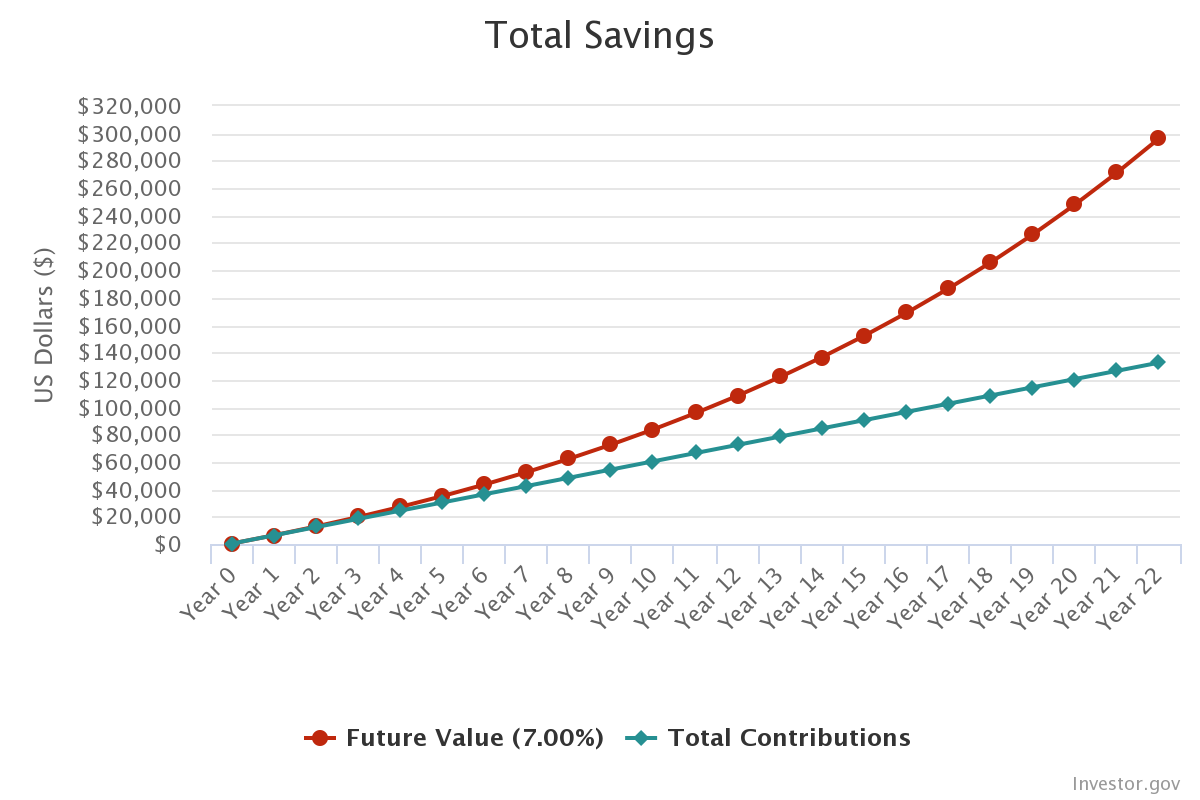
In this example you will have contributed a total of 129.500 meaning more the majority of the 286.000 is pure gains derived from staying invested in the market.
Illustration of 750 Contribution
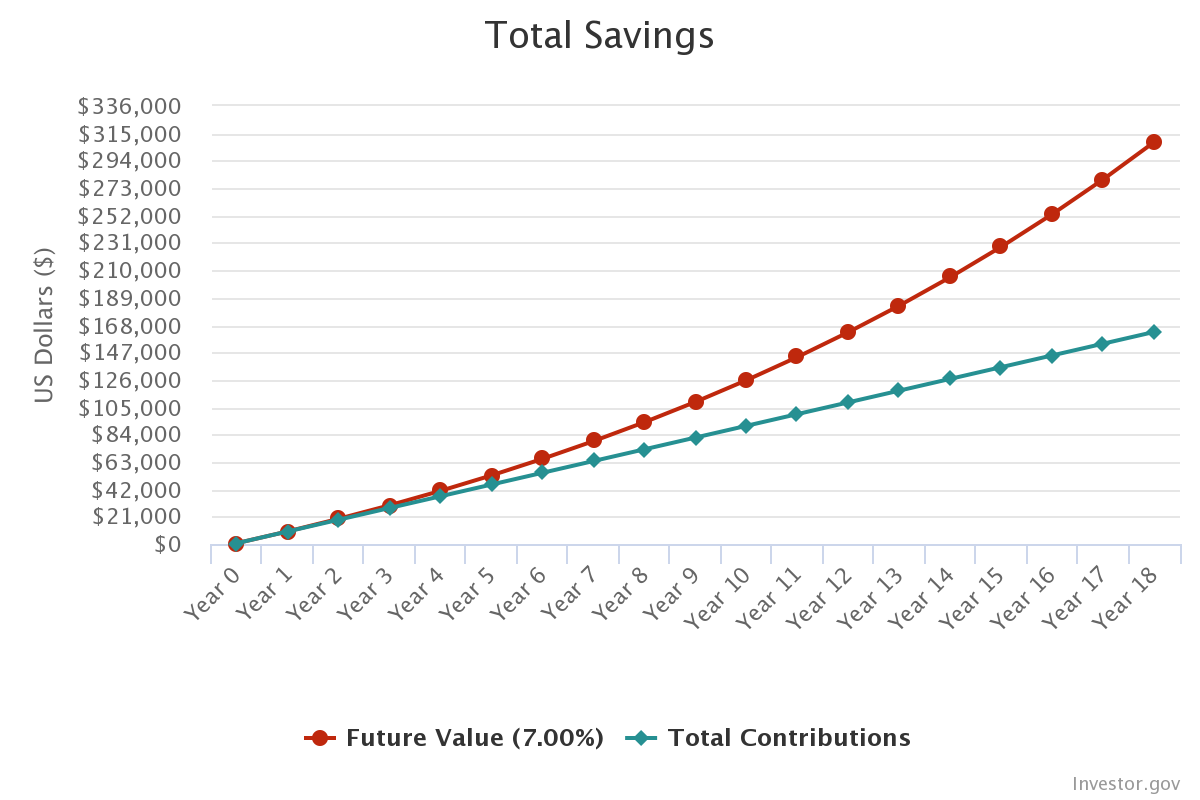
A larger monthly contribution means you will reach the goal of 286.000 in order to earn 20.000 in passive income faster. The yield curve above will not be as steep as their previous charts because you are only contributing for approximately 17 years. If you were to stay invested for 30 years the yield curve will be just as steep as the first example. The longer time frame you have the more you can accumulate.
Final Words
The analysis above does not take into account taxation. Historical performance of stock market is only an indicator of past return and your annual return may vary. Please share link of this article if you find this helpful.