Relative Strength Indicator was developed by J. Welles Wilder and published in 1978. RSI is one of the oldest and most popular tools in technical analysis. The indicator can help to provide an insight into whether an asset is overbought or oversold.
The Relative Strength Indicator RSI compares the size of recent gains and losses in an attempt to determine if the asset is overbought or oversold. The way it is calculated can be found in the formula below.
Calculation
To calculate a 9-day RSI, use the following procedure:
- Calculate the sum of the price changes for the last 9 days, where the price has closed higher than the previous day, and divide this number by 9. This number is called AvgUp.
- Calculate the sum of the price changes for the last 9 days, where the price has closed lower than the previous day, and divide this number by 9. This number is called AvgDn.
Divide AvgUp by AvgDn and add 1.
- Divide 100 by the number in (3).
- Subtract the number in (4) from 100. This number is the RSI value.
RSI = 100 – (100/1 + RS)
RS = AvgUp / AvgDn
Interpretation of signals
Like most indicators, there are two ways in which the indicator is used to generate signals – crossovers and divergence. In the case of RSI, the indicator uses crossovers with the 3 points: overbought (70), oversold (30) and centerline (50).
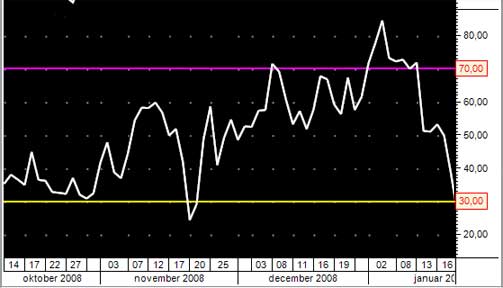
As you can see from the graph below, the RSI fluctuates from 0 to 100. An asset is considered overbought when the RSI approaches 70. This may mean that the asset is being overvalued and that there is an imminent high chance of it will fall back. Likewise, if the RSI approaches 30, it is an indication that the asset may be oversold and therefore has an imminent chance of being undervalued.
A buy signal is generated when the RSI crosses the oversold line in an upward direction. A sell signal is formed when the RSI breaks the overbought line in a downward direction. A more conservative approach can be used when setting overbought and oversold levels at 80 and 20, respectively.
Another crossover technique used in understanding signals is by using the centerline (50). This technique is exactly the same as using the overbought and oversold lines to formulate signals. This technique will often give signals after a movement in the direction they are predicting, but is used more as a confirmation rather than a definite signal compared to the other method. A declining trend is confirmed when the RSI crosses from above 50 to below 50. An upward trend is confirmed when the RSI crosses above 50.
Divergence
Divergence can also be used to generate signals. If the RSI moves in an upward direction and the asset moves in a downward direction, it signals to the technical traders that there is an increasing buying pressure and that the downward direction may well be at its close for this round. Divergence can also be used to signal a reversal in an upward trend, with a declining RSI signaling an increasing selling pressure in an upward trend.
End remark
Those using the RSI should be aware that large increases and decreases in the price of an asset will affect the RSI by creating false buy or sell signals. RSI is best used as a complement to other stock-picking tools.
Investors who use RSI often also use a simple moving average on RSI. This is partly to smooth out strong fluctuations and partly to be able to confirm a certain trend when the RSI crosses its own moving average.