Moving Average is an indicator often used in technical analysis, which shows the average value of a securities price over a specified period. Moving averages are generally used to measure propulsion and define areas of possible support and resistance.
Moving averages come in different forms, but their underlying purpose remains the same: to help technical traders track the development of financial assets by smoothing out the day-to-day price fluctuations, or noise.
Abbreviations of the 3 most used MA
For information, it can be said that there are several versions of the Moving Average (MA). Below are the 3 most used listed:
- SMA – Simple Moving Average
- WMA – Weighted Moving Average
- EMA – Exponential Moving Average
The main difference between these types of moving averages is the weighting of the most recent rates. SMA uses an equal weighting of all the courses included in the calculation, while WMA and EMA weight the most recent courses the most.
Simple Moving Average
The simplest form of a moving average, aptly known as a simple moving average (SMA), is calculated by taking the arithmetic mean of a particular set of values. For example, to calculate a basic 10-day moving average you would lie add closing rates from the last 10 days and then divide the result by 10.
WMA – Weighted Moving Average
Weighted Moving Average is an average of data, calculated over a period in which greater weight is attached to the most recent data. WMA smoothes a data series, which is important in a volatile market as it helps to identify trends much more easily. Weighting is calculated from a sum of days.
WMA is a weighted average of the last n prices, where weighting decreases by 1 with each previous price.
Calculation:
((n * Pn) + ((n – 1) * Pn-1) + ((n – 2) * Pn-2) + … ((n – (n – 1)) * Pn – (n- 1)) / (n + (n – 1) + … + (n – (n – 1)))
Example:
A 4 bar weighted moving average with prices of 1.2900, 1.2900, 1.2903 and 1.2904 would give a moving average of 1.2903 using the calculation method ((4 * 1.2904) + (3 * 1 , 2903) + (2 * 1.2900) + (1 * 1.2900)) / (4 + 3 + 2 + 1) = 1.2903
Exponential Moving Average
This type of moving average responds more quickly to recent price changes than a simple moving average.
The exponential moving average is a weighted average of the last n prices, where weighting decreases exponentially with each previous price.
Calculation:
EMAn-1 + ((2 / (n + 1)) * (Pn – EMAn-1))
Example:
A 4 bar exponentially moving average with prices of 1.5554, 1.5555, 1.5558 and 1.5560 would give a moving average of 1.5558 using the calculation 1.5556 + ((2 / (4 + 1)) * (1.5560 to 1.5556)) = 1.5558
What does the length of the Moving Average mean?
Moving averages allow the user to freely choose which time frame to use. The most common time periods used in moving averages are 20, 50, 100 and 200 days. The shorter the time horizon used to create the average, the more sensitive it will be to price changes.
The longer the time horizon, the less sensitive or smoother the average will be. It is not possible to say in advance which time horizon is the right one to use. The best way to find out which one is best for you is to experiment with a variety of time periods until you find one that suits your strategy.
No Moving Average is fail-safe
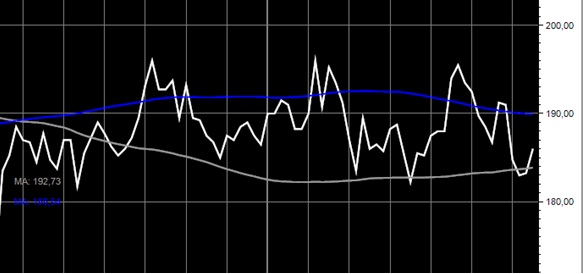
If a stock bounces at the support line of the moving average every single time, then we would all be billionaires. One of the clear disadvantages of using moving averages is that they are relatively useless when the stock price moves sideways compared to when a clear trend prevails.
The stock price can pass through a moving average many times where the trend moves sideways, making it difficult to decide when to trade. This chart is a good example of how the support and resistance characteristics of the moving average are not always present.
Be aware of delay
It is very important to understand that Moving Average are calculated using historical data, eg. events from the past. The delay can cause investors to make trades where it is not advantageous.
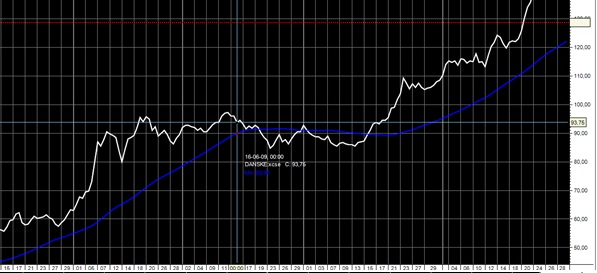
Moving averages are indicators with historical data, which means that they can not predict new trends. However, they can well confirm trends once they have been established. As you can see in the chart below, a stock is considered to be in an uptrend when the price is above a moving average and the average is sloping upwards. Conversely, an investor will use a lower stock price than a downward sloping average to confirm a downward trend. Many investors will only consider holding a long position in a stock when the stock price is trading above the moving average.
Trend
A stock is considered to be in an upward trend when the Moving Average is below the share price at the same time as the Moving Average is moving upwards. The opposite will mean that the stock is in a downward trend.
Momentum
Many ask how it is possible to measure momentum and how moving averages can be used to handle such performance. The short answer is to pay close attention to the deadlines defined to create the different MAs, as each period can provide valuable insight into different types of momentum. In general, momentum in short-term MAs can be measured by looking at moving averages that focus on periods of 20 days or less.
Looking at moving averages defined with a period of 20 to 100 days is generally considered a good measure in the medium term. Any moving average that uses 100 days or more in the calculation can be used as a measure of the long-term.
One of the best ways to measure the strength and direction of a stock’s momentum is to place three moving averages on a chart and then pay attention to how they relate to each other. The three most commonly used definitions of moving averages have different time frames in an attempt to represent short (50), medium (100) and long-term (200) price developments.
Strong upward trend is seen when a moving average with a short time horizon is above a moving average with a longer term and the two averages are divergent. The reverse is true when an average with a shorter horizon is placed below a longer-term moving average.
Support
Moving averages can also be used to measure the support point of a security based on historical price developments. The support points are considered as potential price support and should therefore not be considered as real price support. It does not take long to notice that the falling prices of a security will often stop and turn direction in the same way as an important average.
Resistance
When the price of a security falls below an important support point, such as the 200-day moving average, it is not uncommon to see the moving average act as a strong barrier that virtually prevents investors from pushing the price back above the average.
Many “short” investors will also use these averages as entry points, as the price often jumps back from the resistance line and continues to search lower. Investors who hold a long position in a security should pay close attention when trading below large moving averages such as 200-day average.
Stop Loss
The support and resistance analysis moving averages offer investors makes it a great tool for risk management. Ability to identify strategic places to place stop-loss orders allows investors to avoid major losses in its holdings.
For more information Stop Loss please read the article Stop Loss.