Moving Average Convergence / Divergence (MACD) is one of the most commonly used indicators of price trends and momentum. The indicator holds two moving averages of different lengths up against each other to assess momentum in the time series considered. MACD is a tool for technical analysis.
Moving Average Convergence Divergence
MACD is an oscillator that oscillates around a zero line. It is calculated as the mathematical difference between 2 exponential averages, and the normal lengths of these are 26 for the long and 12 for the short. Some sources indicate – for short-term trading – 13 and 7 days.
When a stock’s MACD line is above 0, the short average is greater than the long one and the stock is in an upward trend by definition – also known as a bullish signal.
Signals
Normally, a 9-day exponential moving average, also called a signal line, is used and the signals occur when the MACD line cuts through its signal line. When the MACD falls below the signal line, it is a bearish signal indicating that it may be time to sell. Conversely, when the MACD moves above the signal line, it indicates a bullish signal, indicating that the price of the security is expected to experience upward momentum.
Brief overview:
- When the MACD is lower than signal, one should consider selling.
- When the MACD is higher than signal, one should consider buying.
- When the MACD crosses the zero line up / down, this is seen as a buy / sell signal.
Many traders wait for the signal line to cross the MA line, as a kind of affirmative signal before trading – to avoid being scammed by various signals.
Divergence
When the price of the security deviates from the MACD, it marks the end of the current trend.
One speaks of divergence, or of either a negative or positive signal, when the MACD begins to move in the opposite direction in the underlying time series. Similarly, a cross between the MACD and the X-axis can be interpreted as a sign that momentum has shifted. Usually, it is also considered a trading signal when the MACD crosses its 9 day EMA.
Dramatic rise
When the MACD rises drastically – that is, when the shorter moving average pulls away from the longer-term moving average – it is a signal that the security is overbought and will soon return to normal levels.
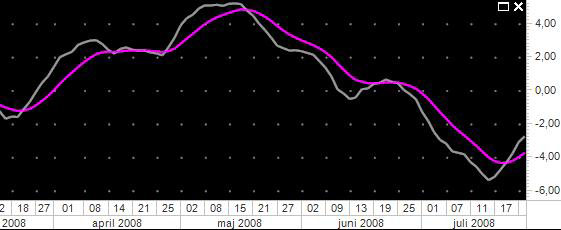
Example of MACD
MACD is indicated in gray and the signal line is indicated in blue.
Calculation of MACD
To calculate the MACD (12; 26; 9), use the following procedure:
- Calculate a 12-day exponential moving average on the course, EMA (12).
- Calculate a 26-day exponential moving average on the course, EMA (26).
- Calculate the difference EMA (12) – EMA (26). This figure is MACD.
- Calculate another 9-day exponential moving average on the MACD, this is the signal line.
Benefits of MACD
- Buy / sell signals are easy to spot.
- There will always be a buy / sell signal in place at a given time.
Disadvantages of MACD
- Naturally, the MACD tool will only give a buy / sell signal after a trend has started.
- It may give too few signals, or too many signals, depending on the investor’s preferences.
- In a highly volatile market, the MACD can provide a large number of signals.